- AI capex supercycle is real: $340B hyperscaler investment in 2025, growing 20%+ in 2026.
- Value chain analysis matters: TSMC, ASML, SK Hynix, Broadcom benefit alongside Nvidia.
- Cyclicality risk is rising: Deceleration from 23% to 8-12% growth would compress 37x SOX P/E.
The semiconductor supercycle thesis
The global semiconductor industry generated $620 billion in revenue in 2025, growing 23 percent year-over-year and surpassing the previous cycle peak of $574 billion in 2021. Unlike the 2021 cycle — driven by pandemic-era consumer electronics demand — the current supercycle is propelled by enterprise AI infrastructure investment, making it structurally different and potentially more durable.
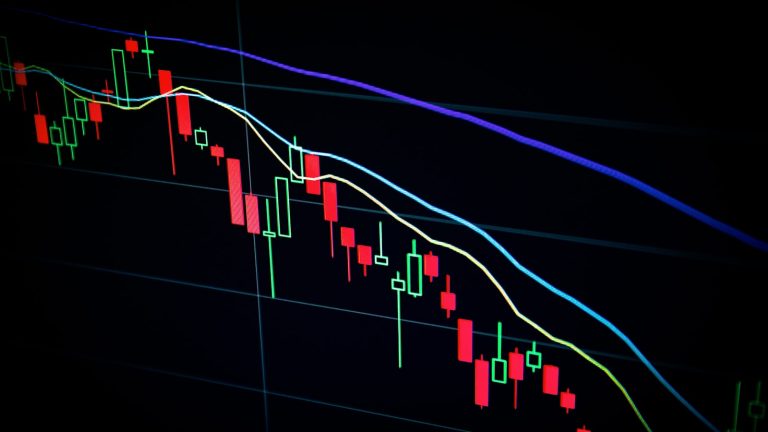
The Philadelphia Semiconductor Index (SOX), which tracks 30 major publicly traded semiconductor companies, has tripled from its October 2022 low of 2,100 to approximately 6,200 in February 2026. The index’s trailing P/E has expanded from 15x to 37x, reflecting the market’s conviction that AI-driven demand will sustain elevated growth rates for multiple years.
Three structural forces underpin the supercycle: (1) the transition from general-purpose computing to AI-optimised hardware (GPUs, TPUs, custom ASICs) requires massive capital investment; (2) advanced node manufacturing (sub-5nm) is concentrated in a single company (TSMC), creating supply constraints that sustain pricing power; (3) geopolitical incentives (CHIPS Act, EU Chips Act) are driving $200 billion in new fabrication plant investments globally.
The AI chip value chain
Understanding semiconductor stocks requires mapping the AI chip value chain, which has four tiers:
Tier 1: Chip designers. Nvidia dominates GPU design for AI training and inference, with an estimated 80-90 percent market share in data centre AI accelerators. AMD is the distant second with its MI300X/MI325X GPUs, holding roughly 8-10 percent share and growing. Intel’s Gaudi 3 has struggled for adoption. Beyond x86 incumbents, custom silicon is emerging: Google’s TPU v6e, Amazon’s Trainium 2, and Microsoft’s Maia 100 are designed for internal workloads, reducing dependence on Nvidia.
Tier 2: Foundries. TSMC manufactures 82 percent of all chips at advanced nodes (7nm and below), including every Nvidia, AMD, Apple, and Qualcomm processor. Samsung Foundry holds 12 percent, and Intel Foundry Services (IFS) is attempting to enter the market with its 18A process node. TSMC’s dominance is a single point of failure for the entire AI ecosystem: a disruption at its Hsinchu or Kumamoto fabs would halt global AI infrastructure deployment.
Tier 3: Equipment makers. ASML is the sole manufacturer of extreme ultraviolet (EUV) lithography machines required for sub-7nm manufacturing. Each EUV system costs $350 million and ASML delivered 55 units in 2025 (revenue $32 billion). Applied Materials, Lam Research, KLA, and Tokyo Electron supply complementary deposition, etch, and inspection equipment. This tier is a natural oligopoly with 70+ percent gross margins.
Tier 4: Memory and interconnect. AI training requires massive memory bandwidth: HBM (High Bandwidth Memory) has become the bottleneck technology. SK Hynix dominates HBM3E production (53 percent share), followed by Samsung (38 percent) and Micron (9 percent). HBM revenue grew 280 percent in 2025 to $28 billion. Broadcom and Marvell supply networking chips (switches, NICs) for data centre interconnect, which is growing 30-40 percent annually.
Nvidia: the centre of gravity
Nvidia’s financial trajectory is historically unprecedented. Data centre revenue grew from $15 billion in FY2023 to $47 billion in FY2024 to $115 billion in FY2025, a compound growth rate of 177 percent over two years. Gross margins expanded from 59 percent to 75 percent as GPU supply constraints allowed premium pricing (an H100 system sells for $25,000-$40,000).
The Blackwell generation (B100, B200, GB200 NVL72) is ramping in 2026, with full production expected by mid-year. Nvidia’s guidance implies data centre revenue of $145-155 billion in FY2026, representing 30-35 percent growth — a deceleration from the triple-digit rates of FY2024-25 but extraordinary by any normal standard.
At $3.2 trillion market cap (38x forward P/E), Nvidia’s valuation embeds high expectations. The bull case projects a total addressable market of $400 billion for AI accelerators by 2028 (versus $120 billion in 2025), implying that Nvidia can grow revenue to $200+ billion while maintaining 70+ percent market share. The bear case argues that AI capex will normalise (hyperscalers cannot sustain $340 billion per year indefinitely), competition from AMD and custom silicon will erode market share, and the next GPU cycle (Rubin, 2027) may face diminishing returns.
The consensus view is that Nvidia is a great company at full price. The risk-reward is more attractive for investors willing to buy on volatility — Nvidia’s stock has had five drawdowns of 20+ percent since 2023, each of which proved to be buying opportunities.
Beyond Nvidia: the rest of the value chain
TSMC ($850B market cap, 22x forward P/E). The most important company in the semiconductor value chain and arguably in the global economy. Revenue grew 26 percent in 2025, driven by AI chip demand (HPC/AI now represents 52 percent of revenue, up from 30 percent in 2022). TSMC’s N3E (3nm enhanced) and N2 (2nm, launching 2025-26) process nodes are 2-3 years ahead of competitors. The geopolitical risk premium (Taiwan Strait) is the most debated factor in the stock; TSMC’s Arizona and Kumamoto fabs are partial mitigants but cannot replicate the scale of Taiwan operations.
ASML ($380B, 28x). The equipment maker with the widest moat in technology. EUV lithography is a monopoly that took $10 billion and 20 years of R&D to develop. The next generation — High-NA EUV (€350 million per unit) — is shipping to Intel and TSMC for sub-2nm research. ASML’s backlog is €56 billion, providing multi-year revenue visibility. Export restrictions to China are a headwind (China was 29 percent of revenue in 2023; down to 14 percent in 2025 after Dutch government restrictions).
AMD ($250B, 25x). The credible challenger in AI GPUs. MI300X GPUs have been adopted by Microsoft Azure, Oracle, and several AI labs. AMD’s AI accelerator revenue reached $10 billion in 2025 (versus near-zero in 2023), though this is still dwarfed by Nvidia’s $115 billion. The opportunity is in inference (running trained models), where AMD’s price-performance may be more competitive than in training.
Broadcom ($820B, 30x). Broadcom has quietly become the second-largest AI chip beneficiary through two businesses: custom AI accelerators (TPUs for Google, AI chips for Apple and Meta) and networking (Jericho3-AI switches for AI data centres). Custom silicon revenue is projected at $18 billion in FY2026. The stock’s valuation reflects the market’s recognition that Broadcom is a picks-and-shovels play on AI infrastructure.
Cyclicality and the normalisation risk
Every semiconductor supercycle in history has been followed by a correction. The industry’s revenue declined 8 percent in 2023 after the 2021 consumer electronics boom. The dot-com bust saw semiconductor revenue fall 32 percent in 2001. The 2008 financial crisis produced a 21 percent revenue decline.
The bull case for the current cycle is that AI demand is secular (long-term) rather than cyclical (demand-pull from a temporary shock). If AI infrastructure spending is analogous to the internet build-out of the late 1990s, then the cycle has years to run because enterprises are still in the early stages of adoption. Less than 5 percent of global data centre compute is currently AI-optimised; the transition to 30-50 percent AI compute over a decade implies sustained demand growth.
The bear case argues that hyperscaler capex is inherently cyclical: companies invest heavily when they see opportunity, then pull back when utilisation does not meet expectations. In 2000-2001, telecom capex collapsed from $120 billion to $60 billion in 18 months. If AI revenue growth disappoints relative to the $340 billion invested, a similar retrenchment is possible.
The most likely scenario is a middle path: AI capex continues to grow, but the rate of growth decelerates from 50+ percent annually to 10-15 percent, which would normalise semiconductor growth from the current 23 percent to a more sustainable 8-12 percent. This normalisation would compress valuations (SOX P/E returning from 37x to 25-28x) without causing a crash, producing flat-to-modest returns for semiconductor stocks from current levels.
Geopolitical risk: CHIPS Act, export controls, and Taiwan
Semiconductors are the most geopolitically sensitive industry in the world. Three policy developments are reshaping the competitive landscape:
US CHIPS Act ($52 billion). Signed in 2022, the CHIPS Act has catalysed $200 billion in announced US fab investments. TSMC (Arizona, $65 billion), Samsung (Taylor TX, $25 billion), Intel (Ohio, $28 billion), and Micron (New York, $100 billion over 20 years) are building or expanding US-based manufacturing. However, construction timelines are 3-5 years, US fabs cost 40-50 percent more than Asian equivalents (higher labour, regulatory compliance), and the talent pipeline is thin (the US graduates 30,000 semiconductor engineers per year versus 300,000 in China).
China export controls. The US has imposed progressively tighter restrictions on semiconductor exports to China since October 2022. The latest rules (January 2025) restrict sales of advanced AI chips (above a performance threshold of ~4,800 TOPS), EUV and advanced DUV lithography equipment, and HBM memory. China’s response has been to accelerate domestic development: SMIC has demonstrated a 7nm process (using older DUV multi-patterning), and Huawei’s Ascend 910B AI chip is deployed in Chinese cloud data centres. However, China remains 3-5 years behind at the frontier, and the gap is widening at advanced nodes.
Taiwan contingency. The scenario that keeps semiconductor investors awake at night is a cross-Strait conflict. TSMC produces 90 percent of the world’s most advanced chips (sub-5nm). A disruption — whether from military conflict, blockade, or even an earthquake — would immediately halt production of GPUs, smartphone processors, and automotive chips. The US CHIPS Act and TSMC’s overseas fabs are partial hedges, but full geographic diversification is a decade away. For investors, the Taiwan risk is an unhedgeable tail event that justifies a portfolio discount but not avoidance of the sector.
“We are in the iPhone moment for artificial intelligence, and the infrastructure must be built to support it. The demand for accelerated computing is insatiable.”
— Jensen Huang, CEO, Nvidia [3]
✓ Advantages
- Nvidia: 80-90% AI GPU market share, 75% gross margins, $115B data centre revenue
- Nvidia: Blackwell ramp provides product cycle momentum through 2027
- Nvidia: Software ecosystem (CUDA) creates deep switching costs
✗ Challenges
- TSMC: Manufacturing monopoly across entire AI value chain (22x P/E, cheaper)
- TSMC: Revenue diversified across AI, mobile, auto, IoT (less customer concentration)
- TSMC: Process technology leadership (N2, A16) widens vs Samsung/Intel
Key takeaways
- ✓ AI capex supercycle is real: $340B hyperscaler investment in 2025, growing 20%+ in 2026.
- ✓ Value chain analysis matters: TSMC, ASML, SK Hynix, Broadcom benefit alongside Nvidia.
- ✓ Cyclicality risk is rising: Deceleration from 23% to 8-12% growth would compress 37x SOX P/E.
- ✓ Geopolitics is unhedgeable: Taiwan risk, export controls, and CHIPS Act reshape competitive landscape.
Sources
- [1] Semiconductor Industry Association, “Global Semiconductor Revenue Forecast 2025-2030,” SIA, 2026-02-01. [Online]. Available: https://www.semiconductors.org/. [Accessed: 2026-02-16].
- [2] Taiwan Semiconductor Manufacturing Company, “TSMC Annual Report 2025,” TSMC Investor Relations, 2026-01-18. [Online]. Available: https://investor.tsmc.com/. [Accessed: 2026-02-16].
- [3] Nvidia Corporation, “Jensen Huang GTC 2026 Keynote Transcript,” Nvidia, 2026-03-18. [Online]. Available: https://www.nvidia.com/gtc/. [Accessed: 2026-02-16].
- [4] ASML Holding, “EUV Lithography: Status and Outlook 2026,” ASML Investor Day Presentation, 2025-11-14. [Online]. Available: https://www.asml.com/en/investors. [Accessed: 2026-02-16].
- [5] Center for Strategic and International Studies, “US Export Controls on Semiconductors: Impact Assessment,” CSIS, 2025-10-15. [Online]. Available: https://www.csis.org/. [Accessed: 2026-02-16].